'Running through the fields, lying flat on the ground': Animating 2020 running goals
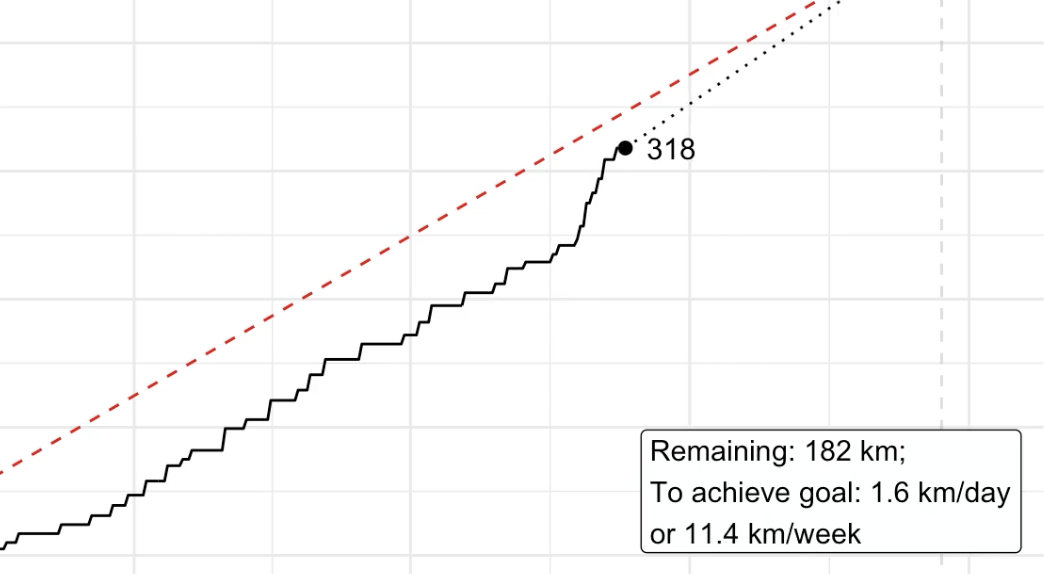
Full disclosure: I did not even have any running goals for 2020. But as it turned out: It has been a good year for running - at least one thing this year was good at. In this post, I want to run you through my R script which creates an animated graph that looks like I had the goal of running 500 kilometres this year (spoiler: I didn’t). This is what the finished graph looks like (for 2020-12-23):